
Insights at UBC Sauder
Responsible Leadership & Sustainability
Politics & Public Policy
Werner’s blog: Taking stock of Canada's GHG emissions at the start of COP28

Posted ─ 2023-11-30

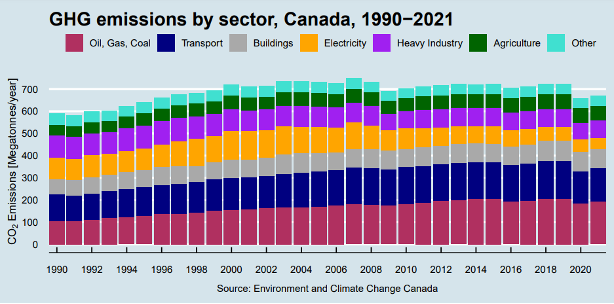
The first chart shows the overall picture for Canada. Since about the year 2000, emissions have
stagnated at 700 Megatonnes per year. Only during the pandemic year 2020 and post-pandemic
year 2021 were emissions down a bit more, and during the recession year 2008. So overall this
picture is not encouraging.
Let us turn to individual provinces, as climate policies differs substantially across provinces and
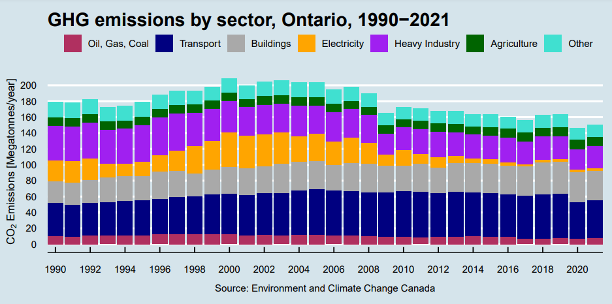
the federal backstop policy only kicked in fully in 2019. First up: Ontario. Canada's largest province
managed to phase out coal from its power grid, and this shows up in the orange bars starting to
shrink rapidly. Emissions from heavy industry have also decreased.


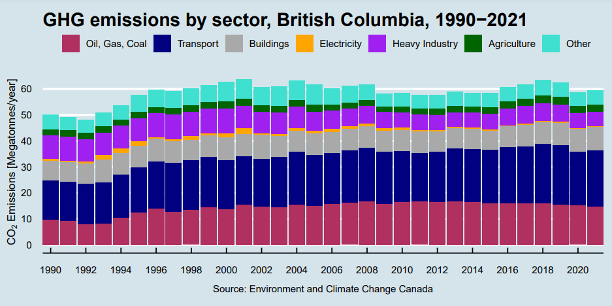
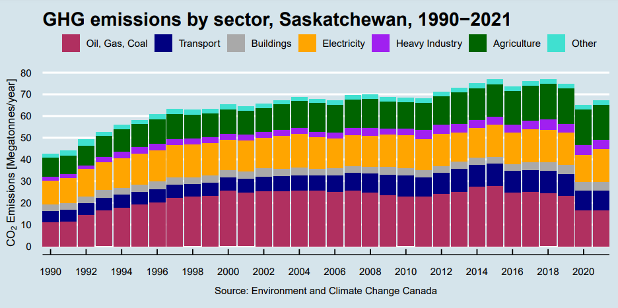
The province of Saskatchewan has Canada's largest footprint on a per-capita basis. The province
has higher emissions than British Columbia even though it only has a quarter of that province's
population. Saskatchewan has an oil and gas sector, it still relies heavily on coal for electricity
generation and it also has large emissions from agriculture.
Let us return to Canada's overall emissions and look more closely at the industry-level emissions.
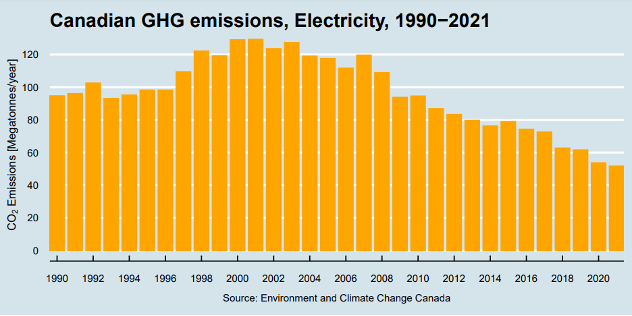
Let's start with Canada's only success story for greenhouse gas reductions: the electricity sector.
Mostly due to replacing coal with natural gas, emissions have been cut more than half. That is an
important accomplishment, and the next stage of replacing natural gas with renewable energy
sources is firmly in sight and is becoming increasingly affordable economically and feasible
technologically.
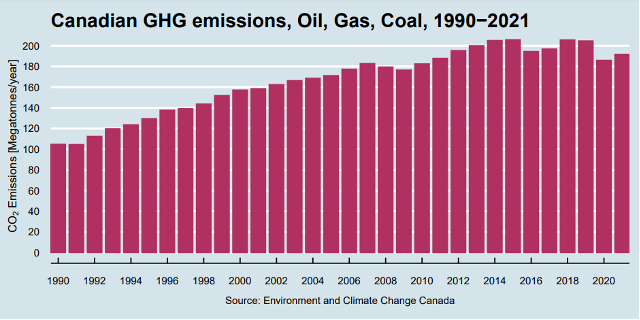
Canada's emissions from the oil and gas industry peaked at over 200 Megatonnes and have been
slightly dampened by the pandemic. Perhaps the good news is that emissions have reached a
plateau. It is clear that Canada will not be able to achieve its ambitions net-zero by 2050 goals
without addressing these emissions drastically. Carbon capture and storage will need to play a
major role to get these numbers down.


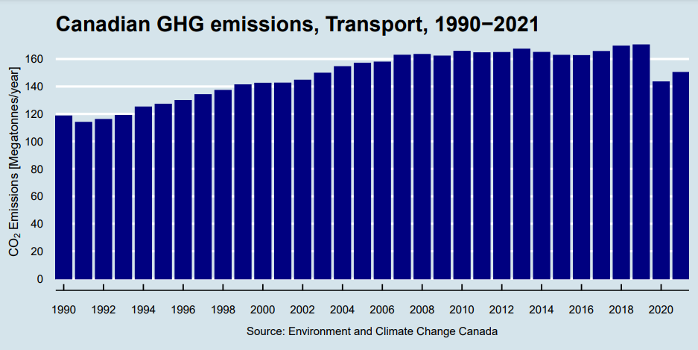
Transportation emissions, the bulk from personal transportation, can be decomposed into separate
scale, composition, and technique effects. The scale is determined by population size and annual
mileage per person. The composition effect captures transportation mode and vehicle fleet
composition. The technique effect identifies how the emission intensity of vehicles changes over
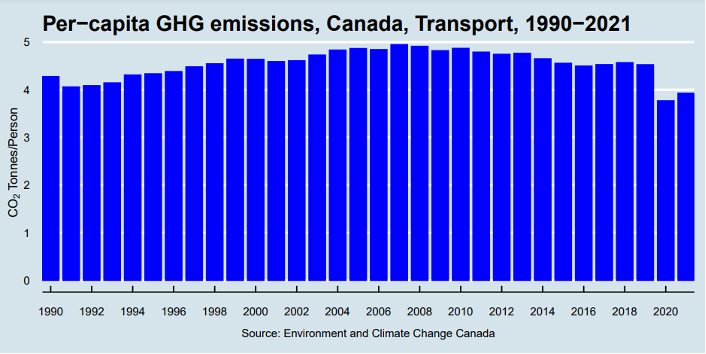
time. Public policy can affect all these components. A simple way of visualizing the major
components involves expressing transportation emissions on a per-capita basis, shown in the next
diagram. Here, the emission intensity is improving slightly since about 2006. Public policies seem
to have a positive effect, although only gradually because fleet turnover is slow and driving
behaviour is relatively price-inelastic. Canada's ZEV mandate is likely going to change this picture
dramatically over the next decade.